Learn more about measures of excess mortality in our work with John Muellbauer and Janine Aron.
Excess mortality during the Coronavirus pandemic (COVID-19) Part I of II - 20220911-123439-q343d678
Document
Excess mortality is a term used in epidemiology and public health that refers to the number of deaths from all causes during a crisis above and beyond what we would have expected to see under 'normal' conditions.1 In this case, we're interested in how the number of deaths during the COVID-19 pandemic compares to the deaths we would have expected had the pandemic not occurred - a crucial quantity that cannot be known but can be estimated in several ways.
Excess mortality is a more comprehensive measure of the total impact of the pandemic on deaths than the confirmed COVID-19 death count alone. It captures not only the confirmed deaths, but also COVID-19 deaths that were not correctly diagnosed and reported2 as well as deaths from other causes that are attributable to the overall crisis conditions.3
We further discuss the relationship between confirmed COVID-19 deaths and excess mortality in the section 'Excess mortality during COVID-19: background.'
How is excess mortality measured?
Excess mortality is measured as the difference between the reported number of deaths in a given week or month (depending on the country) in 2020-2022 and an estimate of the expected deaths for that period had the COVID-19 pandemic not occurred.
The baseline of expected deaths can be estimated in several different ways.
We use an estimate produced by Ariel Karlinsky and Dmitry Kobak as part of their World Mortality Dataset (WMD).4 To produce this estimate, they first fit a regression model for each region using historical deaths data from 2015-2019.5 They then use the model to project the number of deaths we might normally have expected in 2020-2022.6 Their model can capture both seasonal variation and year-to-year trends in mortality.
For more details on this method, see the article Karlinsky and Kobak (2021) Tracking excess mortality across countries during the COVID-19 pandemic with the World Mortality Dataset.7
Previously we used a different expected deaths baseline: the average number of deaths over the years 2015-2019.8 We made this change because using the five-year average has an important limitation - it does not account for year-to-year trends in mortality and thus can misestimate excess mortality.9 The WMD projection, on the other hand, does not suffer from this limitation because it accounts for these year-to-year trends. Our charts using the five-year average are still accessible in links in the sections below.
For reported deaths, we source our data from both WMD and the Human Mortality Database.
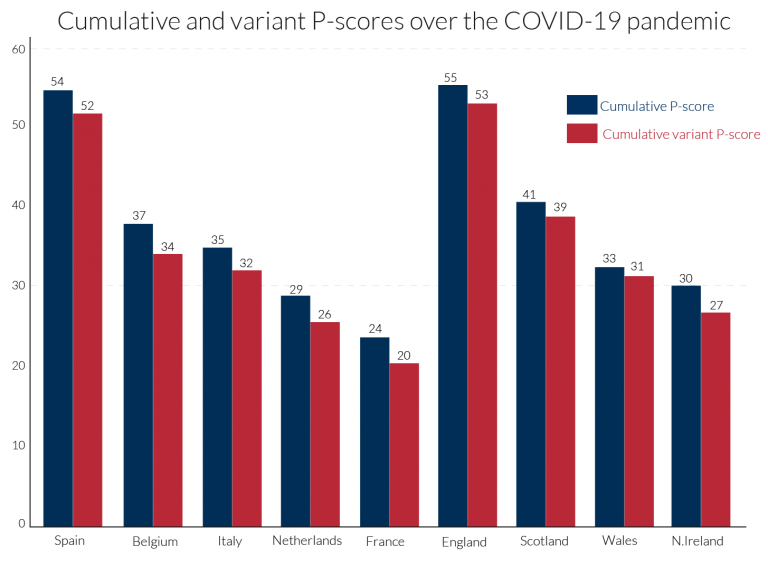
The raw number of excess deaths gives us a sense of scale, but it is less comparable across countries due to large differences in population. To better enable comparisons across countries, we measure excess mortality as the percentage difference between the reported and projected number of deaths. This metric is called the P-score and we calculate it as:10
For example, if a country had a P-score of 100% in a given week in 2020, that would mean the death count for that week was 100% higher than - that is, double - the projected death count for that week.
Excess mortality P-scores
The chart here shows excess mortality during the pandemic for all ages using the P-score. To see the P-scores for other countries click Add country on the chart.
Important points about excess mortality figures to keep in mind
The reported number of deaths might not count all deaths that occurred. This is the case for two reasons:
- First, not all countries have the infrastructure and capacity to register and report all deaths. In richer countries with high-quality mortality reporting systems, nearly 100% of deaths are registered. But in many low- and middle-income countries, undercounting of mortality is a serious issue. The UN estimates that, in "normal" times, only two-thirds of countries register at least 90% of all deaths that occur, and some countries register less than 50% - or even under 10% - of deaths. During the pandemic the actual coverage might be even lower.11
- Second, there are delays in death reporting that make mortality data provisional and incomplete in the weeks, months, and even years after a death occurs - even in richer countries with high-quality mortality reporting systems.12 The extent of the delay varies by country. For some, the most recent data points are clearly very incomplete and therefore inaccurate - we do not show these clearly incomplete data points.13
The date associated with a death might refer to when the death occurred or to when it was registered. This varies by country. Death counts by date of registration can vary significantly irrespectively of any actual variation in deaths, such as from registration delays or the closure of registration offices on weekends and holidays. It can also happen that deaths are registered, but the date of death is unknown - this is the case for Sweden.14
The dates of any particular reporting week might differ slightly between countries. This is because countries that report weekly data define the start and end days of the week differently. Most follow international standard ISO 8601, which defines the week as from Monday to Sunday, but not all countries follow this standard.15 In the charts on this page we use the ISO 8601 week end dates from 2020-2022.16
Deaths reported weekly might not be directly comparable to deaths reported monthly. For instance, because excess mortality calculated from monthly data tends to be lower than the excess calculated from weekly data.17
For more discussion and detail on these points, see our article with John Muellbauer and Janine Aron as well as the metadata from the Human Mortality Database and World Mortality Dataset.


Excess mortality P-scores by age group
The chart here shows P-scores broken down by age groups: ages 0-14, 15-64, 65-74, 75-84, and 85+. The mortality risk from COVID-19 increases with age.18
Countries for which the reported deaths data is sourced from the World Mortality Datasetare not included in this chart because the data is not broken down by age. Though WMD does provide the projected baselines used for calculating P-scores by age in this chart.19
Why is it informative to look at P-scores for different age groups?
The chart in the previous section showed P-scores for all ages - these are impacted by differences in both mortality risk by age and countries' age distributions. For example, countries with older populations - which have a higher mortality risk, including from COVID-19 - will tend to have higher all-age P-scores by default. Looking at the P-scores for different age groups is therefore informative when comparing countries.

Excess mortality using raw death counts
Besides visualizing excess mortality as a percentage difference as we have with the P-scores, we can also look at the raw death count as shown in the chart here. The raw death count gives us a sense of scale: for example, the US suffered roughly 470,000 excess deaths in 2020, compared to 352,000 confirmed COVID-19 deaths during that year.
However, this measure is less comparable across countries due to large differences in populations. You can still see the death counts for other countries by clicking "Change country" on the chart.


Estimated excess mortality from The Economist
Many countries have not reported any data on all-cause mortality during the pandemic. If we want to understand the total impact of the pandemic on deaths in those countries, as well as globally, we must find a way to estimate this death toll.
The Economist built a machine-learning model to estimate the number of excess deaths during the pandemic for 223 countries and regions.20 From these country-level estimates they calculate a global figure.
Globally, the model estimates that the total number of excess deaths is two to four times higher than the reported number of confirmed deaths due to COVID-19.21 You can explore the data for any country or region by clicking "Change country" on the chart.
How should we think about these estimates?
This work by The Economist is one of the most comprehensive and rigorous attempts to understand how mortality has changed during the pandemic at the global level. But these estimates come with a great deal of uncertainty given the large amount of data that is missing and the known shortcomings even for data that is available.
We can think of them as our best, educated - but still ballpark - estimates. Some of the specific figures are highly uncertain, as the large uncertainty intervals show. But the overall conclusion remains clear: in many countries and globally, the number of confirmed deaths from COVID-19 is far below the pandemic's full death toll.


To open a link or graphs, right click on the link and select open in a new tab.
The original document can be found using the Reference Link in the lower right hand corner.